The product
Analytics that admit what they do not know
Views, engagement and followers across every channel, with a clear line between measured and estimated.
Included from the Free plan. See what each plan covers.
What it is
How analytics that admit what they do not know works
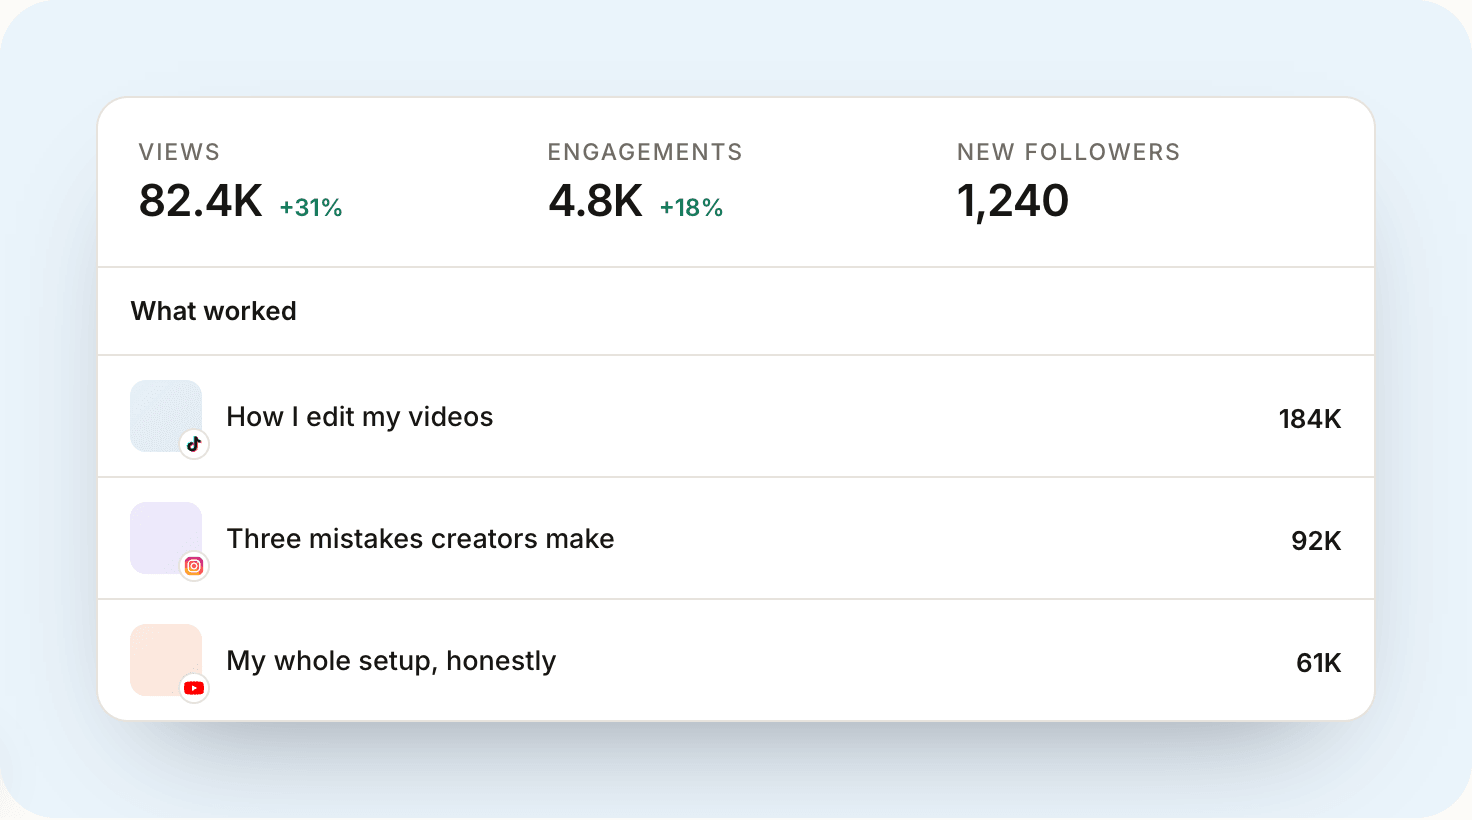
Views, engagement and follower numbers for every connected channel, over 7, 28, 60 or 365 days (Pro adds a custom range and a comparison with the period before). Overview, content and follower views, with the top posts that actually earned the numbers.
Click any post for its real totals and what it gained inside the window you are looking at. Both, never one alone, because a lifetime total and a 7-day gain answer different questions and are easy to confuse.
Where a platform reports nothing, you get a dash rather than a zero. A metric that was never measured is not the same as a metric that came back empty, and the app never pretends otherwise.
Why it matters
The problem underneath it
Analytics decide what you make next, so a number that is subtly wrong is worse than no number. Most tools smooth over gaps in platform data and hand you a confident figure built on a guess.
It is also what a rate card should be built from. Median views across a real sample is a defensible basis for a price; a good week is not.
Who it is for
And who it is not for
Creators on several platforms
Where per-app analytics stop being comparable and start being a chore.
Anyone pricing their work
The numbers here are what the rate card reads from.
People reporting to a brand
A shareable summary is more convincing than a folder of screenshots.
Alternatives
What people use instead
Some of these are genuinely the right answer. It depends on whether your posting is attached to money yet.
Each platform's native analytics
The most accurate source there is, and where some numbers only ever exist. The work is that there is one per app and none of them compare.
A screenshot folder
What most media kits are made of. It works right up until a brand asks for a figure across a period you did not screenshot.
A dedicated analytics suite
Deeper than Vantr on audience demographics, and priced for agencies. If demographic breakdowns are what you need, use one.
Questions
The things people ask first
How far back does it go?
Connecting a channel imports its existing posts and lifetime totals. Follower history is the exception: platforms mostly do not hand over a daily series, so that starts from when Vantr began watching, and the app says so rather than drawing a line it invented.
Why is a number here different from the platform's own app?
Usually because the platform exposes a different metric through its API than it shows in its own dashboard. Where that happens the app shows what it can actually verify.
What is a good engagement rate?
It depends on platform and size far more than most benchmarks admit. There is a guide below that gives real ranges instead of one number.
Related guides
Worth reading next
What is a good engagement rate (and why it matters more than followers)
Brands care more about engagement than follower count, and so should you. How to calculate it, what's actually good, and how to improve it.
Read itThe best time to post on each platform (and why it's a myth)
General 'best time to post' charts are mostly useless. Here's the real answer, and how to find the time that actually works for your audience.
Read itHow to get more views on YouTube Shorts
YouTube Shorts is the most underrated growth engine for creators. Here's how the Shorts algorithm works and how to get more views.
Read itSee it against your own channels
Start free, no card. Paid plans come with a 7-day free trial.